So the citywide number only tells part of the story. Freeways, the ports, the ocean breeze, and the mountains ringing the basin each push readings their own way. The Air Quality Index squeezes all of that into one number for one spot, and whichever pollutant is worst there right now sets it. I first noticed this when neighbors a short drive apart compared readings that didn't match, and it changed how I look at the air inside a home, too.
TL;DR Quick Answers
air quality index los angeles
The air quality index in Los Angeles can change from one block to the next. Traffic near freeways and ports pushes nitrogen dioxide and fine particles highest within a few hundred feet, while ozone forms over hours and peaks in the inland valleys on hot afternoons. Check the reading closest to where you are.
Near freeways and ports: Nitrogen dioxide and fine particles run highest, then fade within a few hundred feet of the road.
Inland valleys: Ozone peaks on hot afternoons as the sea breeze pushes smog toward the mountains.
Coast: Usually cleaner, since fresh ocean air arrives there first.
Your number: Whichever pollutant is worst at that spot sets the AQI.
Your fix: A MERV 13 filter helps on particle days. Ozone is a gas, so keep windows closed through the afternoon peak.
Top Takeaways
Location beats the headline. Readings can change across a few blocks, so check the one closest to you.
Traffic pollution stays local. It peaks beside freeways and ports and fades within a few hundred feet.
Smog travels. Ozone takes hours to form and peaks inland on hot afternoons.
Apps disagree for good reasons. Each one uses its own sensors, time windows, and lead pollutants.
Match the fix to the pollutant. Filters handle particles, while timing and closed windows handle ozone.
Why Los Angeles Air Quality Shifts Block by Block
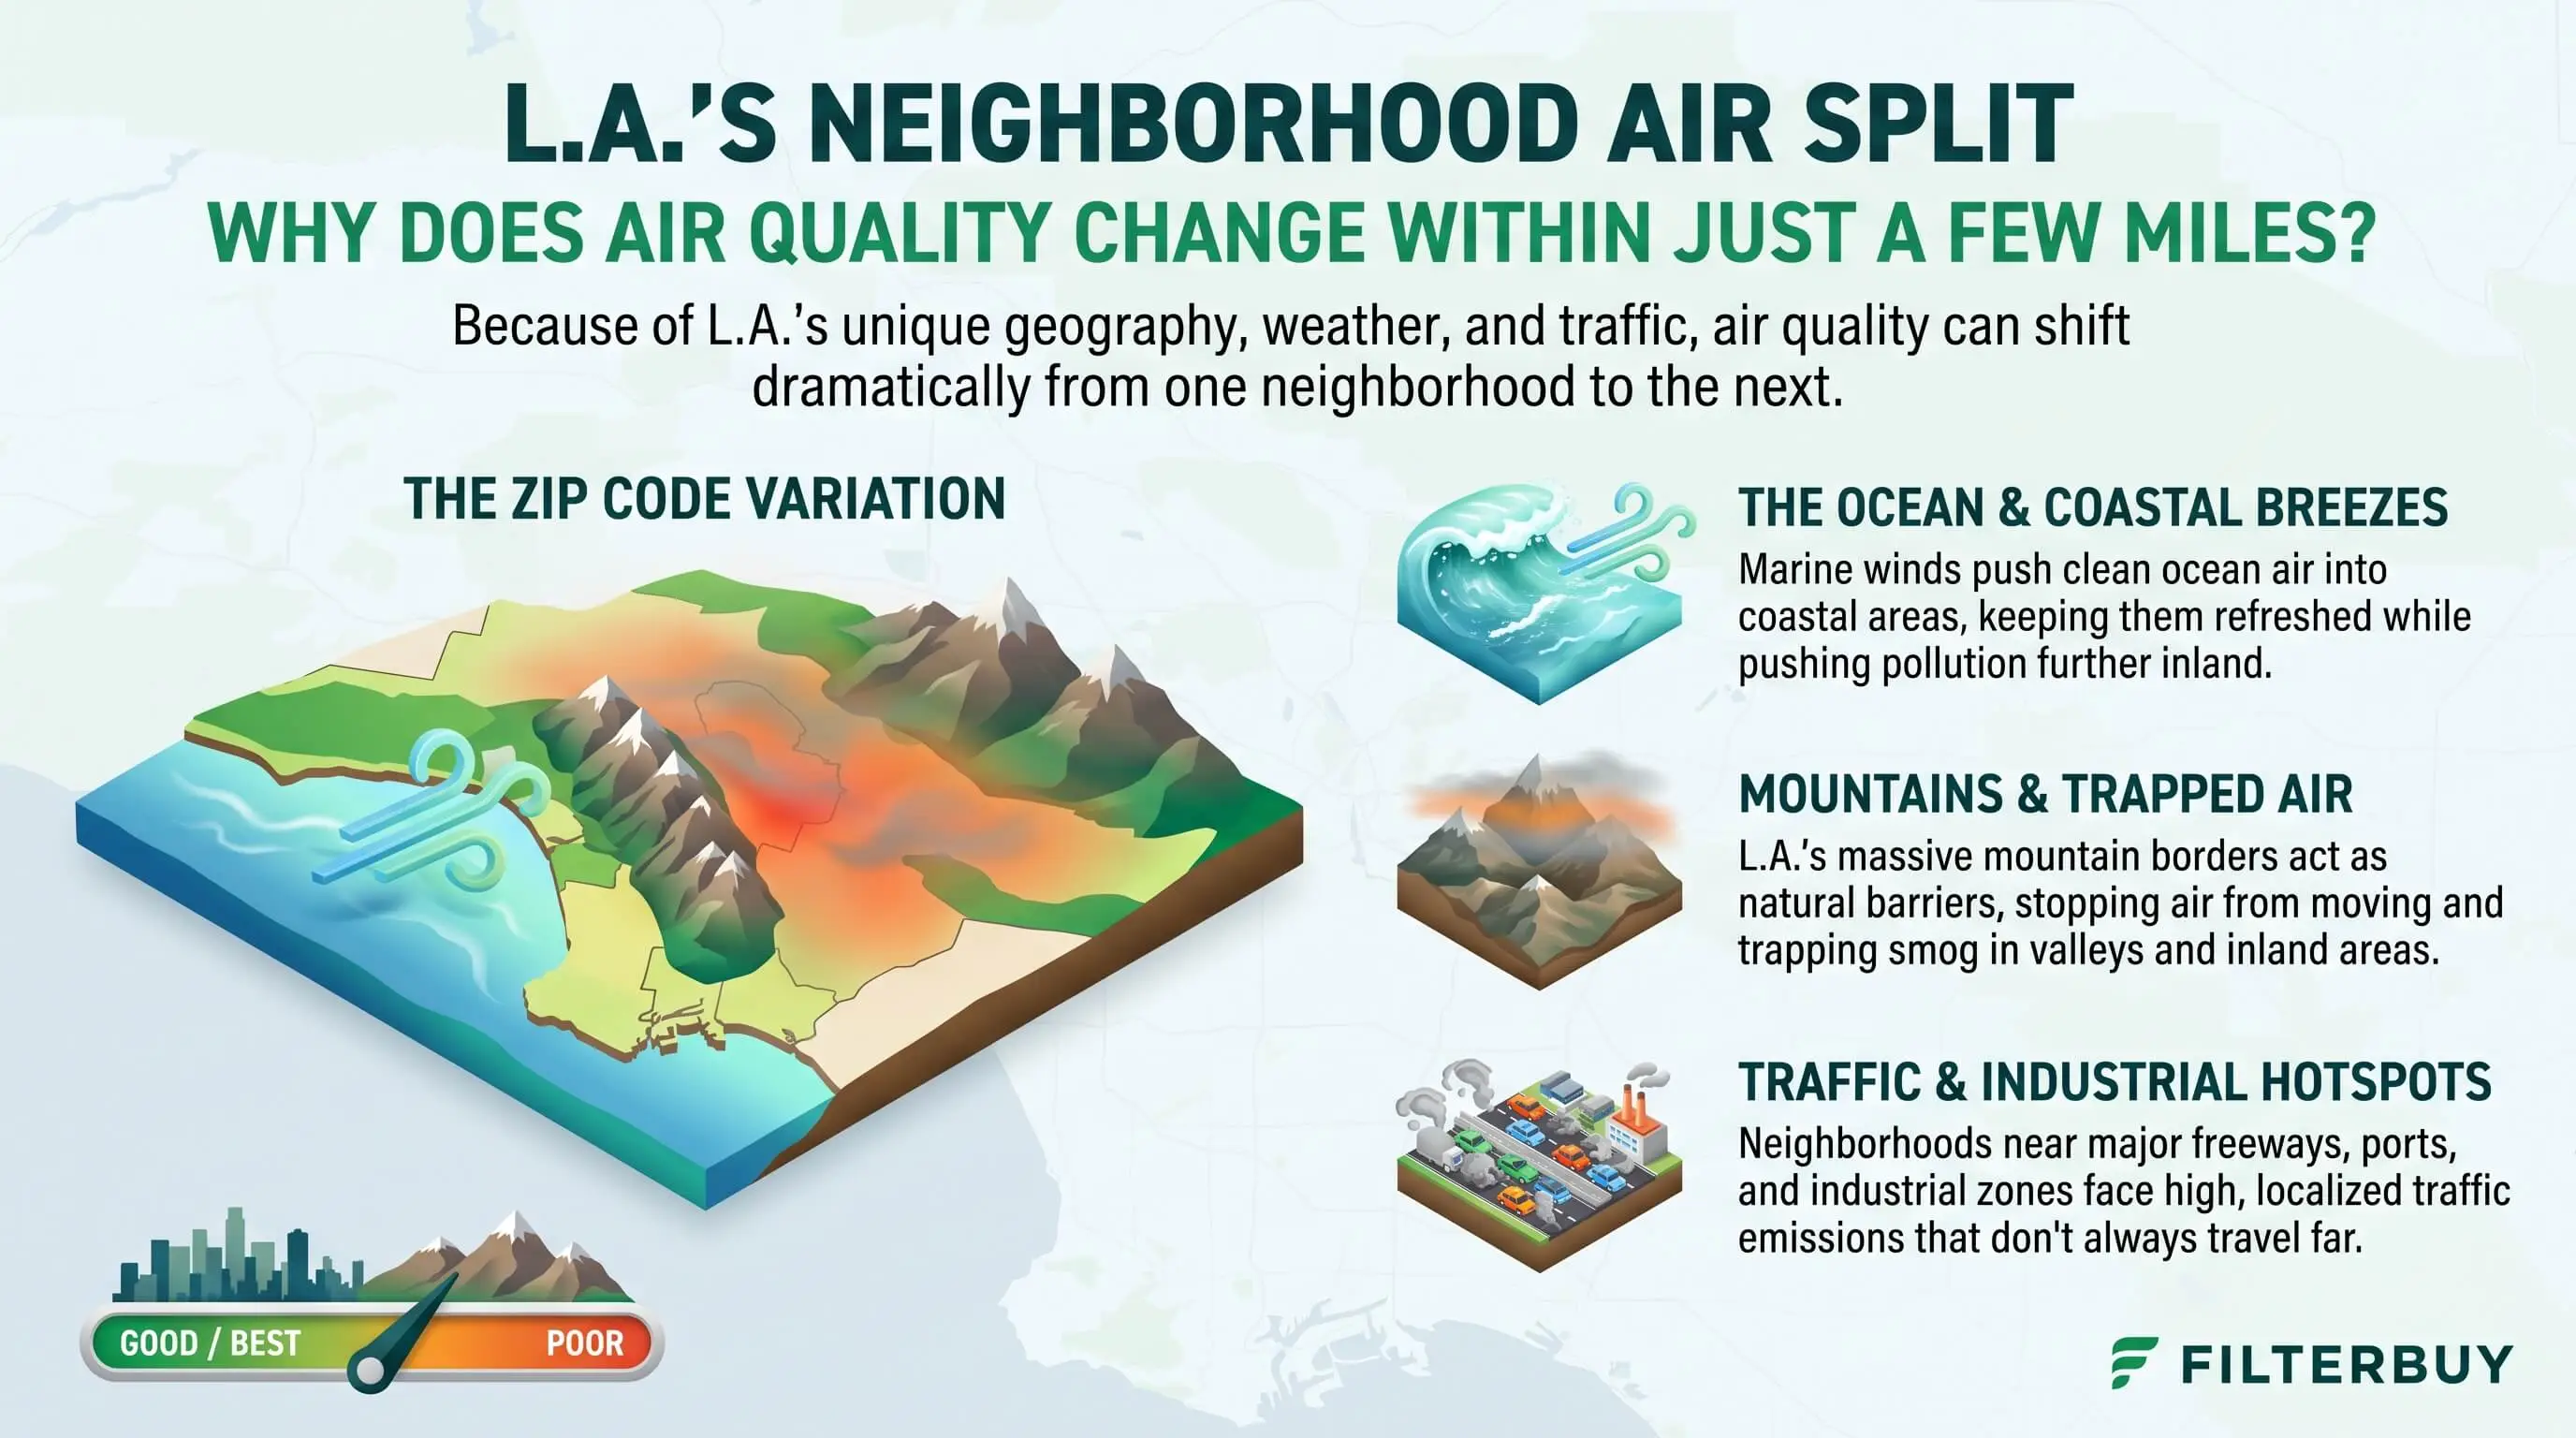
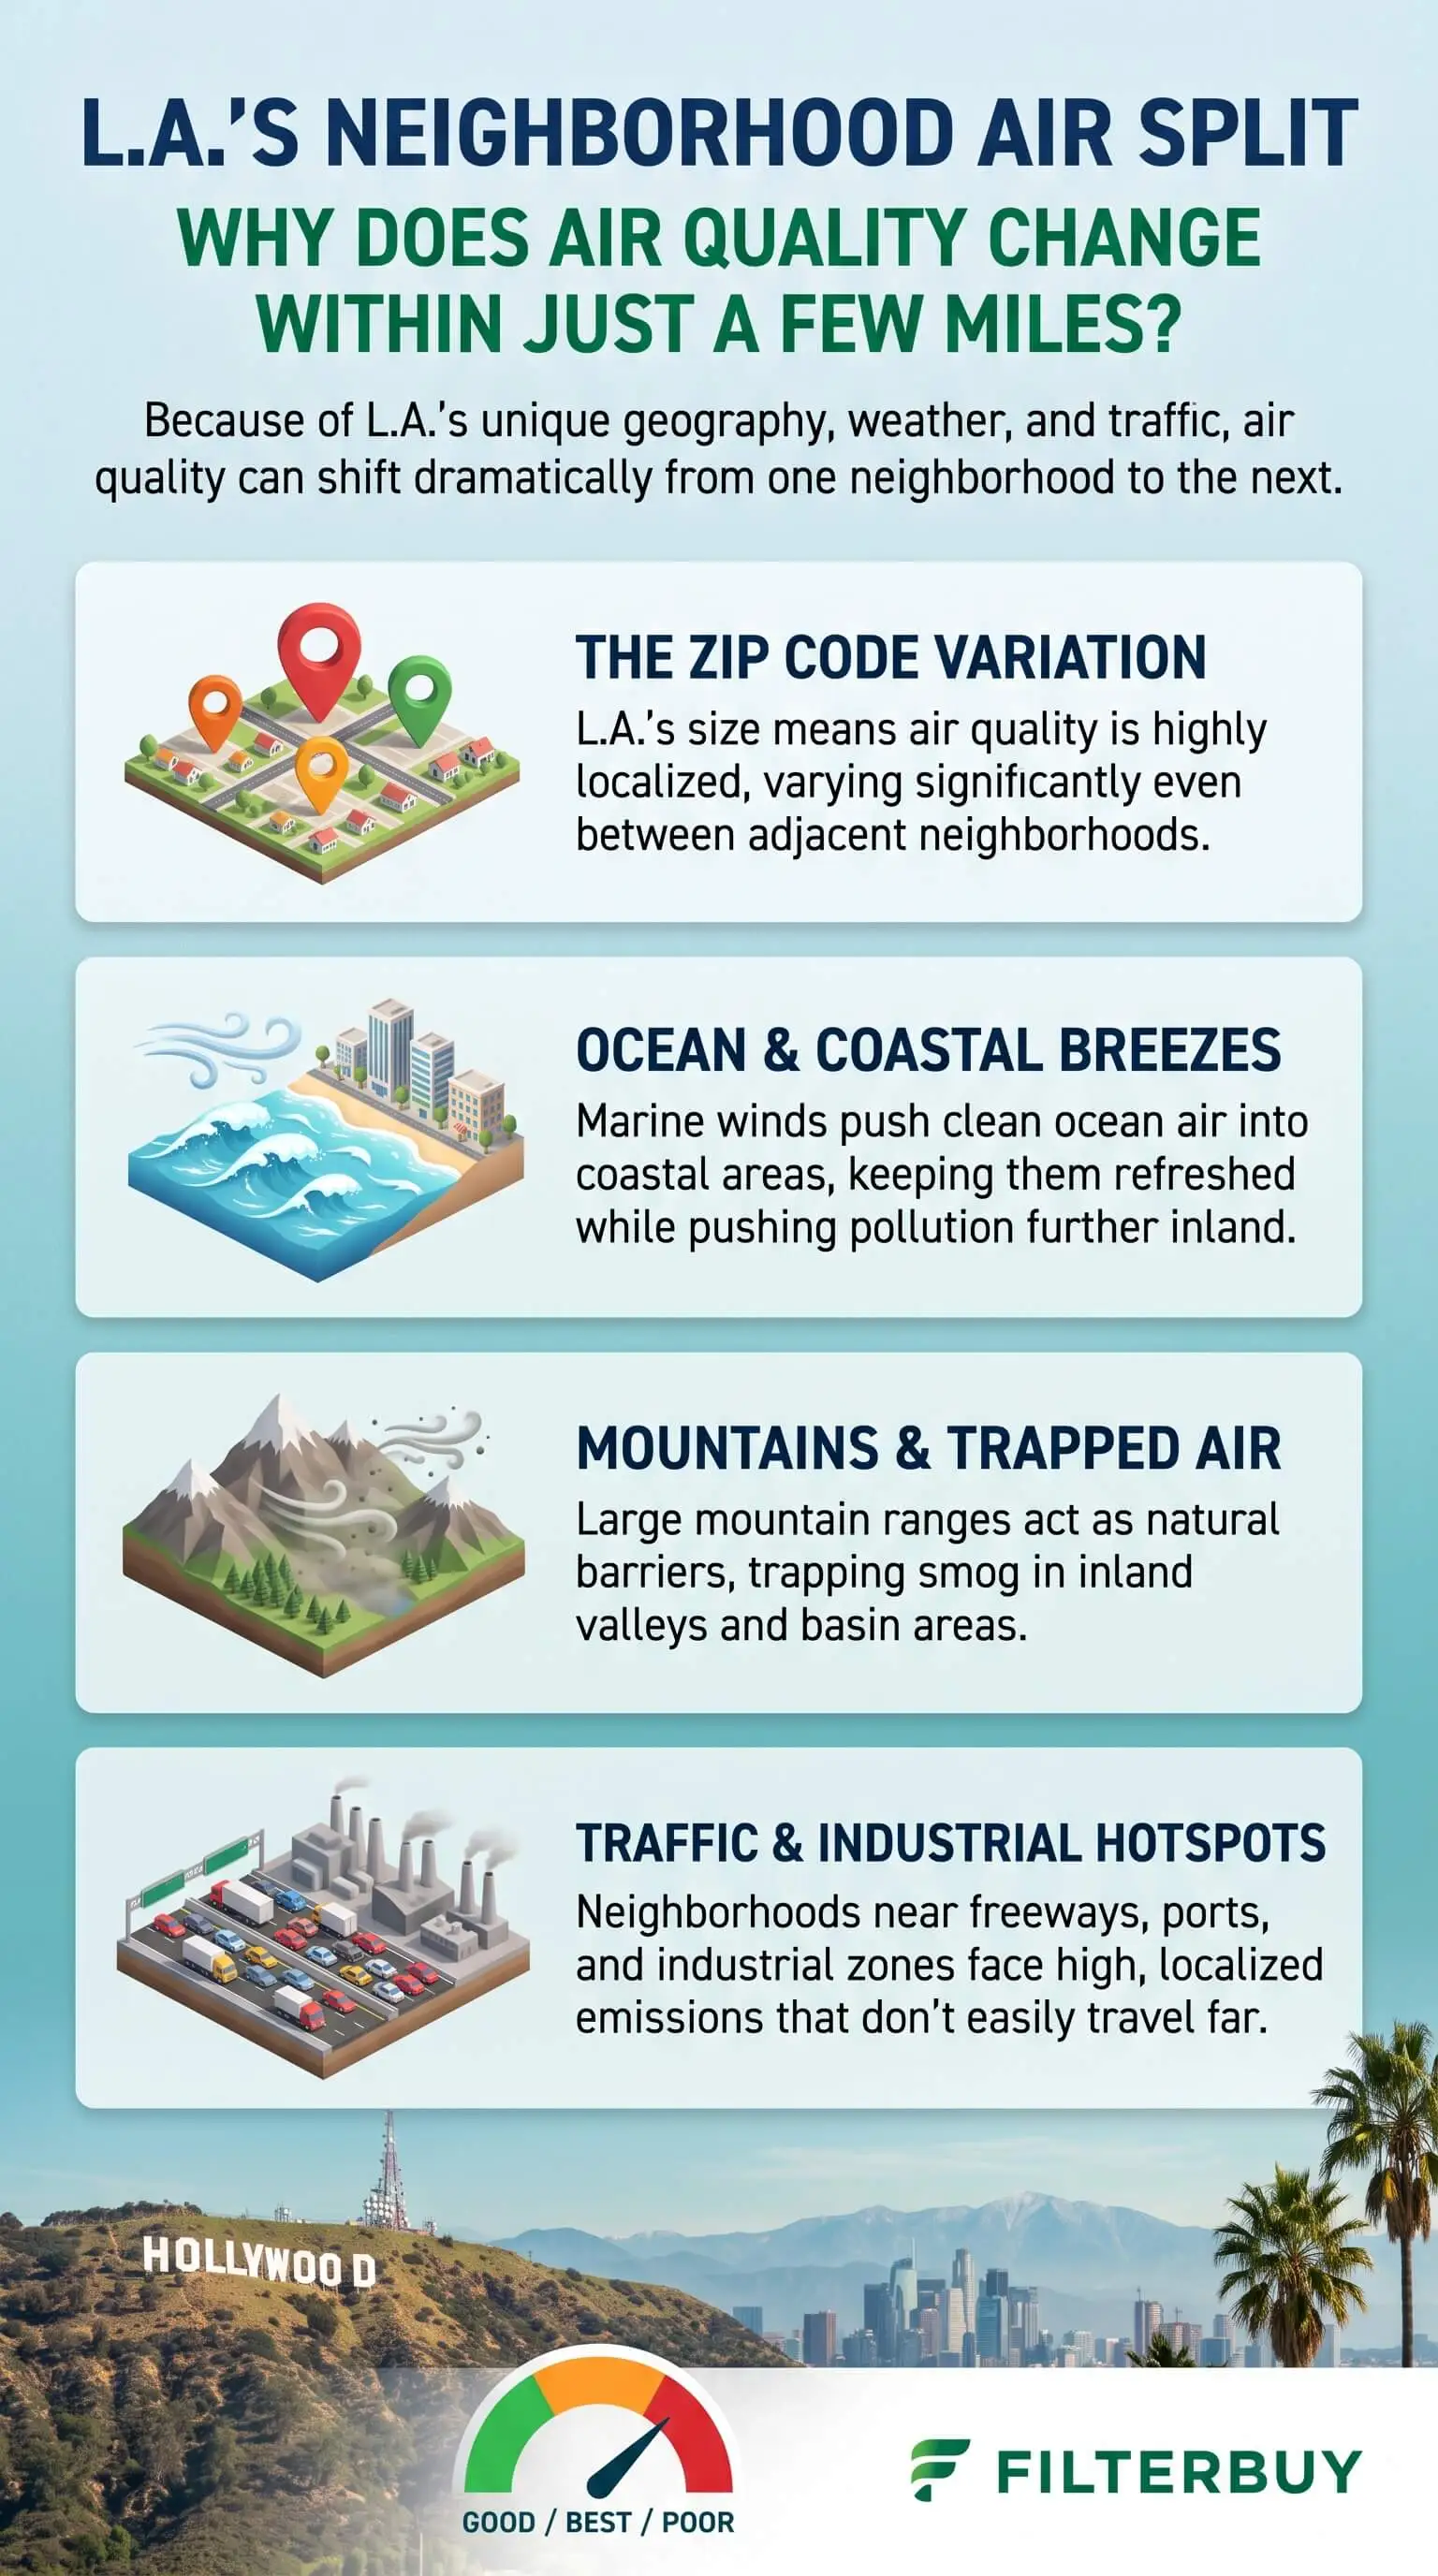
Los Angeles air varies this sharply because its biggest pollution sources sit in fixed places while the weather spreads their output unevenly. Traffic exhaust piles up beside freeways and ports. Smog takes longer, forming over several hours as it drifts downwind and inland. Then the geography of the basin traps both under a warm layer of air that works like a lid. These conditions help explain why air quality index Los Angeles readings vary so widely between neighborhoods.
The Basin, the Lid, and the Sea Breeze
Los Angeles sits in the South Coast Air Basin, a coastal plain boxed in by mountains to the north and east. On most days, warm air settles over the cooler marine air near the ground. That temperature inversion keeps pollution from rising and thinning out.
Every afternoon the sea breeze picks up and pushes inland, carrying the morning's emissions from the coast and downtown into the valleys and the Inland Empire until the mountains stop it. That's why a beach neighborhood often reads cleaner than a valley town on the same hot day.
Freeways, Ports, and the 500-Foot Rule
Traffic pollution stays close to home. Nitrogen dioxide and ultrafine particles, diesel soot among them, run highest right next to a busy road and thin out within a few hundred feet. The California Air Resources Board takes that distance seriously enough to advise against building new homes and schools within 500 feet of a freeway.
The ports, along with the rail yards and truck routes that serve them, add their own diesel exhaust to nearby streets. Even a small airport counts. UCLA researchers found that Mar Vista, near Santa Monica Airport, had worse ultrafine particle levels than downtown and Boyle Heights, two areas laced with freeways. What sits upwind of your block matters more than your ZIP code.
Why Smog Peaks Where Traffic Isn't
Ground-level ozone, the main ingredient in LA smog, never leaves a tailpipe as ozone. It forms when vehicle and industrial emissions react in sunlight, and that takes hours. By its peak in mid to late afternoon, the sea breeze has carried it miles inland. Right beside a freeway, fresh exhaust can even use up some ozone, so readings there often run lower than you'd guess.
That's how a neighborhood next to the 110 can log high nitrogen dioxide and modest ozone while a quiet foothill town logs the opposite, at the same hour, in the same city.
Why Two Apps Show Two Different Numbers
Every air quality app pulls from its own mix of sensors and its own time window, and some lead with a different pollutant than others. South Coast AQMD builds its map from regulatory monitors, hundreds of low-cost sensors, and a forecast model to estimate conditions at 1,218 locations. The number on your phone is usually an estimate for your area rather than a measurement taken on your street.
Monitors and sensors: Regulatory monitors are precise but sit far apart, and low-cost sensors fill the gaps once agencies correct their data.
Time windows: Particle and ozone readings average several hours of data, so spikes show up late.
Dominant pollutant: One app may lead with PM2.5 and another with ozone, so check which one sets the number.
Distance: A monitor two miles away reports the air two miles away.
When the Gaps Get Widest
Summer afternoons inland: Ozone climbs in the valleys while the coast stays mild.
Still mornings near freeways: Rush-hour exhaust hangs low along busy corridors until the sea breeze arrives.
Santa Ana wind days: Offshore winds reverse the usual pattern and shove pollution and dust toward the coast.
Wildfire smoke: A shift in wind direction can put one neighborhood in the red while another, a few miles off, stays yellow.
What a Tight House Does Near a Busy Corridor
Don't take your indoor air for granted, especially near a freeway! Outdoor pollution doesn't stay outdoors. It slips in through gaps around windows, doors, attic hatches, and ducts. A well-sealed, properly insulated home lets far less of it inside, and that pays off on a smoggy afternoon or a smoke day.
There's a tradeoff. A tighter home also hangs on to whatever does get in, so your filter has more work to do. Here's exactly how to match your setup to the pollutant in charge:
Particles like PM2.5, soot, and smoke: A MERV 8 filter, or the highest rating your system can handle, catches much of the fine-particle load. Switch the thermostat fan from "Auto" to "On" on bad days.
Ozone: Particle filters can't catch a gas. Keep the windows shut through the afternoon peak and air the house out once ozone drops.
Pro Tip: Living near a freeway changes the best time to open your windows. Morning rush hour is the worst moment on the traffic side of the house, and late afternoon belongs to ozone. Late morning, after the commute and before smog builds, usually gives you the cleanest window. Using a high quality filter in your HVAC system can also help reduce indoor airborne particles when outdoor pollution levels rise.
How I Check My Block Before Heading Out
My check takes about a minute and works anywhere in the basin.
Pull up the neighborhood-level reading closest to where you'll actually be, not the citywide headline.
Find the pollutant driving that number.
For particles, filter up indoors and keep your time beside heavy traffic short.
For ozone, move outdoor plans to the morning.
I use the same habit in very different climates, and I walk through it in my guides to Rochester air quality by month and Washington DC air quality.
"In my years testing homes along Los Angeles freight corridors, I've watched fine-particle readings run higher in the rooms facing the freeway than in the rooms facing away from it. So I tell homeowners their streets can matter as much as their city, and I have them seal the leaky side of the house before they buy anything."
7 Essential Resources
Los Angeles Real-Time AQI Tracker: Live readings by neighborhood, the pollutant driving each one, and alerts when the air turns unhealthy.
South Coast AQMD: Current Air Quality Data: The district's hourly AQI map, built from monitors, sensors, and modeling across 1,218 locations.
OEHHA: CalEnviroScreen 4.0: Pollution burden scores by census tract that show exposure shifting from one neighborhood to the next.
National Weather Service: Los Angeles/Oxnard: Forecasts for the marine layer, heat waves, and Santa Ana winds that swing air quality day to day.
San Pedro Bay Ports Clean Air Action Plan: The plan the ports of Los Angeles and Long Beach follow to cut diesel and other port pollution.
UCLA Sustainable LA: Neighborhood Transit Pollution Study: The study that found sharp gaps in ultrafine particles between LA neighborhoods.
AirNow: AQI Calculator: Converts an AQI value into a pollutant concentration, handy when two apps disagree.
3 Supporting Statistics
The American Lung Association's 2026 "State of the Air" report ranked Los Angeles-Long Beach the most ozone-polluted metro in the country again, with an average of 159.2 unhealthy ozone days a year from 2022 to 2024. The metro also ranked seventh worst for both short-term and annual particle pollution. American Lung Association, State of the Air 2026
The EPA counts more than 45 million people in the U.S. living within 300 feet of a major transportation facility or infrastructure, especially busy roads. U.S. EPA Near Roadway Air Pollution Research
The California Air Resources Board recommends against putting new homes, schools, and other sensitive uses within 500 feet of a freeway or an urban road that carries 100,000 vehicles a day. California Air Resources Board
Final Thoughts and Opinion
I think the citywide air quality number undersells how much your exact address matters in Los Angeles. A regional headline can read Moderate while the block beside the freeway runs worse on particles and the foothills run worse on ozone.
That gap is a reason to look closer instead of tuning the number out. Figure out which pollutant your neighborhood fights most, then set up your home for that one. That's where you get to be the hero of your household.
Frequently Asked Questions
Why Is Air Quality Worse in the Inland Empire Than at the Beach?
The afternoon sea breeze carries emissions from the coast and downtown inland. Along the way they turn into ozone, and the mountains hold it over the valleys while beach towns get the fresh ocean air first.
How Far From a Freeway Does Traffic Pollution Drop Off?
Most of it thins out within a few hundred feet. For that reason, the California Air Resources Board advises against building homes and schools within 500 feet of a freeway.
Why Do Different Apps Show Different AQI Numbers for Los Angeles?
Each app draws on different monitors and sensors, averages over a different stretch of time, and may lead with a different pollutant.
What Time of Day Is Los Angeles Air Quality Worst?
Ozone usually peaks in mid to late afternoon, especially inland. Next to freeways, particles and nitrogen dioxide tend to run highest at rush hour.
Does a MERV 13 Filter Help With Los Angeles Smog?
It helps with the particle side of smog, like soot and smoke. Ozone is a gas, though, so the filter won't remove it. Keep the windows closed through the afternoon peak.
Does the AQI Measure Pollen?
No. The AQI covers ozone, particle pollution, carbon monoxide, sulfur dioxide, and nitrogen dioxide.
Know Why the Air on Your Block Is Different
Check the reading closest to your home and see which pollutant is setting the number, and you'll know whether the few miles between you and the next neighborhood are working for you or against you. Then set up your house to match, with a sealed envelope, the right filter, and UV light installation to help control microbial growth in your HVAC system, so the air inside stays steady even when the air outside doesn't.